
![]() The Neuro
fMRI/DTI Combi Package is a bundle of:
The Neuro
fMRI/DTI Combi Package is a bundle of:
- Inline BOLD Imaging :Performing a Motor Cortex Functional Exam
- 3D PACE syngo : Prospective Acquisition CorrEction
- BOLD 3D Evaluation syngo
- fMRI Trigger Converter
- Diffusion Tensor Imaging
- DTI Evaluation
- DTI Tractography syngo
The bundle comprehends all acquisition and postprocessing tools
for comprehensive BOLD fMRI and DTI exams. BOLD fMRI experiments
can be displayed fused with DTI data and anatomy. The package is
particularly valuable for presurgical planning. The 3D display
of anatomical images, functional brain mapping results and DTI
allows a better understanding of the spatial relationship
between eloquent cortices, cortical landmarks, brain lesions and
tract shifts of white matter.
Inline BOLD Imaging
The BOLD imaging package allows the user to define protocols
which, apart from the measurement, configure automatic
evaluation of the measured data during the scan. With Inline
Technology it is thus possible to generate statistical images
(t-value) based on 3D motion corrected and spatially filtered
data automatically in real time without any further user
interaction. The Inline display of activation cards allows the
user to decide during the scan whether enough statistical power
has built up for his brain mapping task or if the examination is
corrupted by motion. As a result examinations will be shorter
with a higher success rate. Functional brain mapping can be
easily integrated into the clinical routine e.g. prior to
neurosurgical interventions.
Additional Features:
- Inline retrospective 3D motion detection and correction in 3
rotational and 3 translational directions
- Inline t-statistics calculation for variable paradigms and
display of t-value images
- Statistical evaluation by means of “General Linear Model
(GLM)”:
- Paradigms can be configured
- Transitions between passive and active states can be modeled
by the hemodynamic response function
- Correction of low-frequency trends
- Allows for time delays due to the BOLD-EPI slice order during
a measurement
- Display of GLM design matrix
- Display of a continuously updated t-value card during
measurement
- Display of colored activation cards continuously updated
during measurement, overlaid over the respective BOLD images
using Inline technology
- MOSAIC image mode for accelerating display, processing and
storage of images
3D PACE syngo
By tracking the patients head 3D PACE reduces motion resulting
in increased data quality beyond what can be achieved with a
retrospective motion correction. As a result the sensitivity and
specificity of BOLD experiments are increased.
Features:
- Real time prospective motion correction: Highest accuracy real
time motion detection algorithm feeding a real time feed back
loop to the acquisition system with updated positioning
information
- 3D motion correction for 6 degrees of freedom (3 translation
and 3 rotation)
- Motion related artifacts are avoided in first place instead of
correcting for them retrospectively
- Significant reduction of motion-related artifacts in
statistical evaluations
- Increased sensitivity and specificity of BOLD experiments
BOLD 3D Evaluation syngo
All tasks from statistical evaluation of the fMRI datasets to
reading and exporting results are supported by BOLD 3D
Evaluation syngo:
Generation of statistical maps:
- In cases an inline calculated statistical map is not available
a statistical map can be generated easily using processing
protocols. An intuitive editor UI allows the paradigm definition
and offers the selection of head motion correction, image
filters and statistical evaluation.
- Predefined processing protocols and paradigms are available,
which can be edited if required.
Statistical evaluation using General Linear Model (GLM)
- Transitions between passive and active states modeled by the
hemodynamic response function.
- Correction of low-frequency trends.
- Corrects for time delays due to the BOLD-EPI slice order
during a measurement.
- Output of a t-value map and the GLM design matrix
Inline monitoring of the fMRI exam
- During an ongoing BOLD imaging exam results are calculated (by
Inline BOLD imaging) and displayed in real time.
- The results are displayed and continuously updated as an
overlay on online adjustable, free angulated cut planes through
the anatomical 3D data set.
- The evolving signal time courses in task-related areas of
activation can be displayed and monitored.
Visualization of fMRI Results
- Visualization with 3D volume rendering.
- Superimposing on cut planes through the volume.
- Interactive Navigation: Zoom, pan and rotate in 3D without
noticeable delay. Free double oblique angulation of up to 6 cut
planes.
- Cine display of the BOLD time series and of EPI volumes in 3
orthogonal cuts for evaluation of non-corrected head motion.
Data Quality Monitoring
- Based on the B0 field map, loaded automatically with the fMRI
data, areas with less reliable results are indicated.
fMRI Trigger Converter
An optical trigger signal is available to trigger external
stimulation devices in fMRI experiments.
With the "fMRI Trigger Converter" this signal can be converted
to an electrical signal (TTL/BNC and RS 232 interface for PC;
modes: toggle or impulse).
Diffusion Tensor Imaging
Diffusion Tensor Imaging allows for a complete description of
the diffusion properties of the brain within the scope of the
tensor diffusion model, both for anisotropic and isotropic
diffusion. Efficient diffusion direction schemes are pre-defined
to allow for optimal diffusion directional resolution. Schemes
with up to 256 directions can be selected.
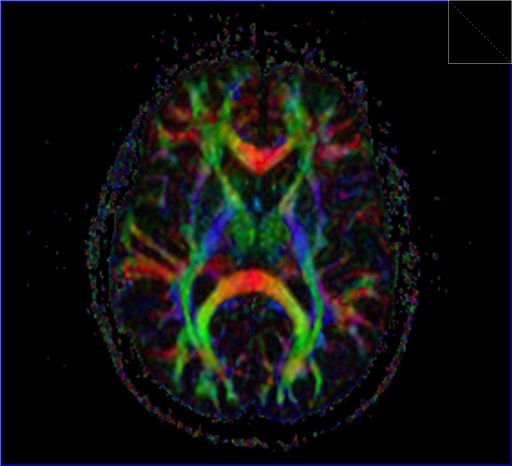
Inline technology enables automatic and immediate calculation of
the diffusion tensor, including grey-scale and colored
“fractional anisotropy" (FA) map derived from it.
Details:
- Measurements with up to 256 different directions and with up
to 16 different b-values
- Inline calculation of tensor, grey-scale and colored FA map,
ADC map and trace-weighted image
- Support of parallel imaging (iPAT)
- Clinical protocols with full head coverage, incl. inline
calculation of tensor, FA, ADC and trace-weighted images in 4
minutes.
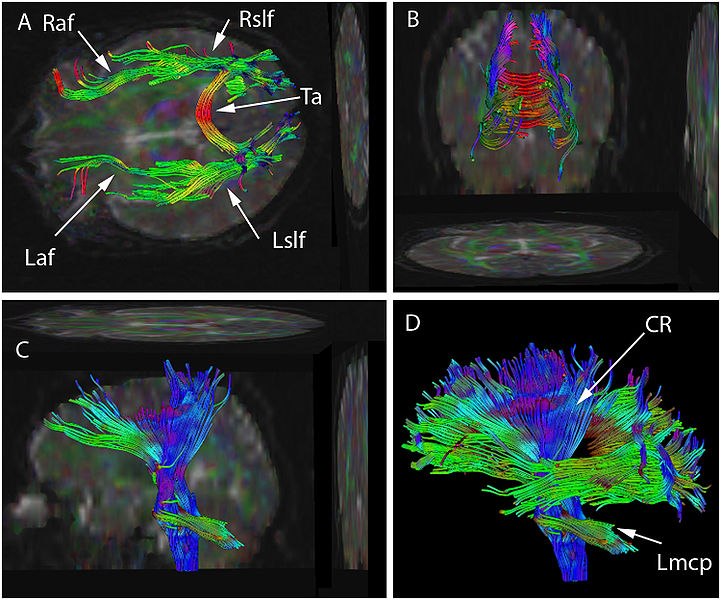
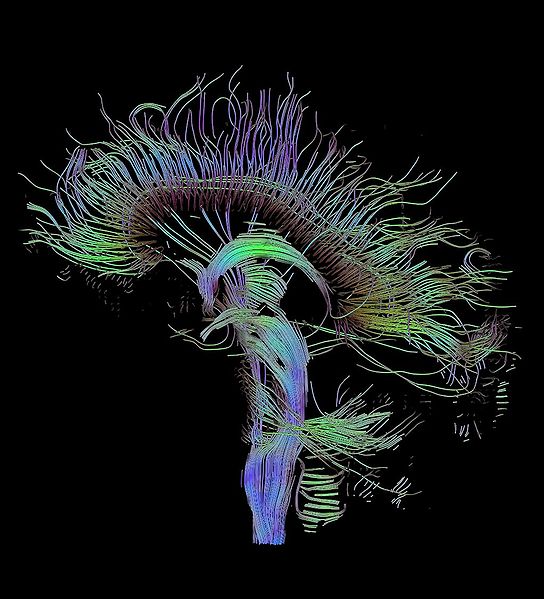
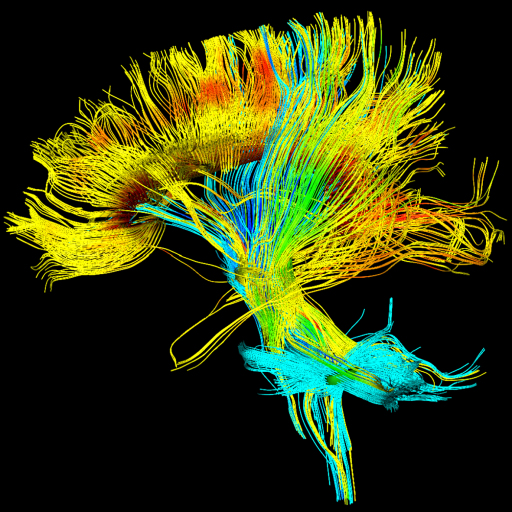
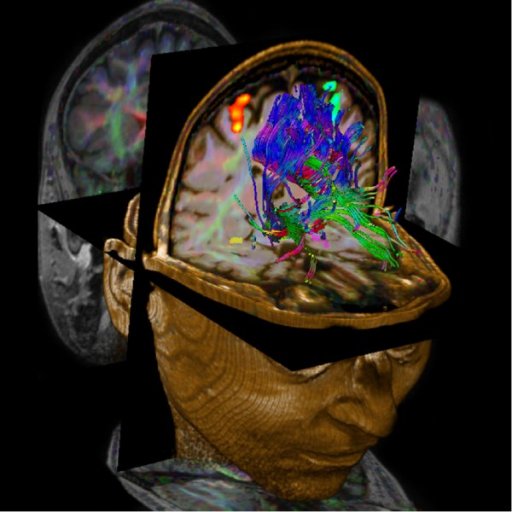
DTI Tractography syngo
syngo DTI Tractography is optimized for the clinical use by
providing advanced 3D visualization of white matter tracts in
the context of 2D or 3D anatomical datasets and DTI datasets.
DTI data sets can be explored fast and intuitively using the
interactive QuickTracking. QuickTracking instantaneously
displays the tract originating from the mouse pointer position
while moving over the DTI data set. This also allows identifying
qualified regions to place seeding ROIs. Seed points can be set
to assess connectivity by tracking with single ROI and with
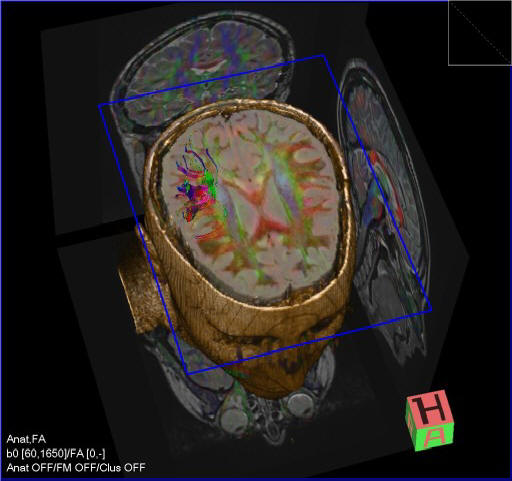
multiple ROIs. Furthermore they can be placed in fused views
displaying the anatomical reference and e.g. the colored FA map
simultaneously.
Texture Diffusion, a highly versatile in-plane visualization of
white matter tracts, allows to display and read DTI Tractography
results on PACS reading stations and in the OR.
At the same time the package provides the scientific user with
the flexibility to configure the tracking algorithm and to
change display settings for the tracts. Tract and seeding ROI
statistics are included to support publications (e.g. mean/max
FA value, min/mean/max ADC value).
All views can be exported as DICOM images or bitmaps. Tract and
seeding ROI statistics can be exported as html files.
DTI Evaluation
Clinical applications are supported by a dedicated DTI
evaluation mode to support diagnostics of white matter diseases
(e.g. multiple sclerosis and brain maturation disorders). Based
on the tensor, in addition to the already inline-calculated
parameter maps, further maps characterizing the anisotropy of
diffusion properties can be calculated and stored. Multiple
diffusion parameter maps (e.g. Fractional Anisotropy, ADC, b=0)
and an anatomical image are displayed next to each other in the
same slice position for comparison. The images can be evaluated
together based on ROIs and the results can be documented in a
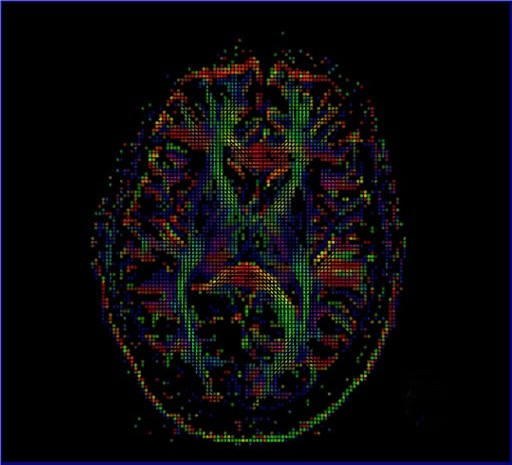
table. The display options include 2D and 3D tensor graphics,
colour-coded images and overlay images on the anatomical images.
In addition, the package offers the scientific user full
flexibility of 2- and 3-dimensional visualization of the
diffusion tensor with measures of isotropic and anisotropic
(fractional and relative) diffusion, Eigen vectors (E1, E2, E3)
of the diffusion tensor and shape-descriptive measures of the
diffusion tensor (linear, planar, spherical).