|
|
Information box |
The main purpose of this site is to extend the
intraoperative monitoring to include the neurophysiologic
parameters with intraoperative navigation guided with Skyra 3
tesla MRI and other radiologic facilities to merge the
morphologic and histochemical data in concordance with the
functional data.
 CNS Clinic
Located in Jordan Amman near Al-Shmaisani hospital, where all
ambulatory activity is going on.
Contact: Tel: +96265677695, +96265677694.
Skyra running
A magnetom Skyra 3 tesla MRI with all clinical applications
started to run in our hospital in 28-October-2013.
Shmaisani hospital
The hospital where the project is located and running diagnostic
and surgical activity. |
|
 |
|
|
Functional magnetic resonance imaging or functional MRI (fMRI)
is a type of specialized MRI scan used to measure the
hemodynamic response (change in blood flow) related to neural
activity in the brain or spinal cord of humans or other animals.
It is one of the most recently developed forms of neuroimaging.
Since the early 1990s, fMRI has come to dominate the brain
mapping field due to its relatively low invasiveness, absence of
radiation exposure, and relatively wide availability.
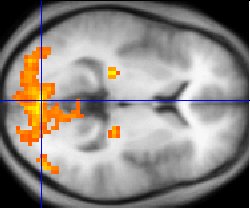 |
| fMRI statistics (yellow) overlaid on an average of the brain
anatomies of several humans (gray) |
Since the 1890s it has been known that changes in blood flow and
blood oxygenation in the brain (collectively known as
hemodynamics) are closely linked to neural activity. When
neural cells are active they increase their consumption of
energy from glucose and switch to less energetically effective,
but more rapid anaerobic glycolysis. The local response to
this energy utilization is to increase blood flow to regions of
increased neural activity, which occurs after a delay of
approximately 1–2 seconds. This hemodynamic response rises to a
peak over 4–6 seconds, before falling back to baseline (and
typically undershooting slightly). This leads to changes in
local cerebral blood volume and local changes in the local
concentration of oxyhemoglobin that are detectable through their
paramagnetic effects.
 History
Blood-oxygen-level dependence (BOLD) is the MRI contrast of
blood deoxyhemoglobin, first discovered in 1990 by Seiji Ogawa
at AT&T Bell labs. Ogawa and colleagues had recognized the
potential importance of BOLD for functional brain imaging with
MRI, but the first successful fMRI study was reported by John W. Belliveau and colleagues in 1991 using an
intravenously
administered paramagnetic contrast agent (Gadolinium). Using
a visual stimulus paradigm, localized increases in blood volume
(32 +/- 10 percent, n = 7 subjects) were detected in the primary
visual cortex. In 1992, three papers were published using
endogenous BOLD contrast MRI. One was submitted by Peter Bandettini at the Medical College of Wisconsin on February 5,
revised March 31, accepted March 31 and published in the June
1992 issue of Magnetic Resonance in Medicine (MRM). The second
by Kenneth Kwong and colleagues also applied BOLD to image human
brain activities with MRI and was submitted on March 26 and
published in the June issue of PNAS in 1992. In the same
year, Dr. Ogawa submitted their result on March 31 and published
in July issue of PNAS. In the following year, Dr. Ogawa
published the biophysics model of BOLD contrast in Biophysical
Journal. Dr. Bandettini also published a further paper in 1993
demonstrating quantitative determination of functional
activation maps.
Physiology
As neurons do not have internal reserves for
glucose and oxygen, more neuronal activity requires more glucose
and oxygen to be delivered rapidly through the blood stream.
Through a process called the hemodynamic response, blood
releases glucose to neurons and astrocytes at a greater rate
than in the area of inactive neurons. It results in a surplus of
oxyhemoglobin in the veins of the area and distinguishable
change of the local ratio of oxyhemoglobin to deoxyhemoglobin,
the "marker" of BOLD for MRI.
Hemoglobin is diamagnetic when oxygenated (oxyhemoglobin) but
paramagnetic when deoxygenated (deoxyhemoglobin). The
magnetic resonance (MR) signal of blood is therefore slightly
different depending on the level of oxygenation. Higher BOLD
signal intensities arise from increases in the concentration of
oxygenated hemoglobin since the blood magnetic susceptibility
now more closely matches the tissue magnetic susceptibility. By
collecting data in an MRI scanner with sequence parameters
sensitive to changes in magnetic susceptibility one can assess
changes in BOLD contrast. These changes can be either positive
or negative depending upon the relative changes in both cerebral
blood flow (CBF) and oxygen consumption. Increases in CBF that
outstrip changes in oxygen consumption will lead to increased
BOLD signal, conversely decreases in CBF that outstrip changes
in oxygen consumption will cause decreased BOLD signal
intensity. The signal difference is very small, but given many
repetitions of a thought, action or experience, statistical
methods can be used to determine the areas of the brain which
reliably show more of this difference as a result, and therefore
which areas of the brain are active during that thought, action
or experience.
Almost all current fMRI research uses BOLD as the method for
determining where activity occurs in the brain as the result of
various experiences, but because the signals are relative and
not individually quantitative, some question its rigor.
Other methods which propose to measure neural activity more
directly have been attempted (for example measurement of the
Oxygen Extraction Fraction (OEF) in regions of the brain, which
measures how much of the oxyhemoglobin in the blood has been
converted to deoxyhemoglobin or direct detection of magnetic
fields generated by neuronal currents), but because the
electromagnetic fields created by an active or firing neuron are
so weak, the signal-to-noise ratio is extremely low and
statistical methods used to extract quantitative data have been
largely unsuccessful as of yet.
Neural correlates of BOLD
The precise relationship between neural signals and BOLD is
under active research. In general, changes in BOLD signal are
well correlated with changes in blood flow. Numerous studies
during the past several decades have identified a coupling
between blood flow and metabolic rate; that is, the blood
supply is tightly regulated in space and time to provide the
nutrients for brain metabolism. However, neuroscientists have
been seeking a more direct relationship between the blood supply
and the neural inputs/outputs that can be related to observable
electrical activity and circuit models of brain function.
While current data indicate that local field potentials, an
index of integrated electrical activity, form a marginally
better correlation with blood flow than the spiking action
potentials that are most directly associated with neural
communication , no simple measure of electrical activity to
date has provided an adequate correlation with metabolism and
the blood supply across a wide dynamic range. Presumably, this
reflects the complex nature of metabolic processes, which form a
superset with regards to electrical activity. Some recent
results have suggested that the increase in cerebral blood flow
(CBF) following neural activity is not causally related to the
metabolic demands of the brain region, but rather is driven by
the presence of neurotransmitters, like glutamate, serotonin, nitric oxide, acetylcholine, dopamine and
noradrenaline.
Some other recent results suggest that an initial small,
negative dip before the main positive BOLD signal is more highly
localized and also correlates with measured local decreases in
tissue oxygen concentration (perhaps reflecting increased local
metabolism during neuron activation). Use of this more
localized negative BOLD signal has enabled imaging of human
ocular dominance columns in primary visual cortex, with
resolution of about 0.5 mm. One problem with this technique
is that the early negative BOLD signal is small and can only be
seen using larger scanners with magnetic fields of at least 3
Tesla. Further, the signal is much smaller than the normal BOLD
signal, making extraction of the signal from noise more
difficult. Also, this initial dip occurs within 1–2 seconds of
stimulus initiation, which may not be captured when signals are
recorded at long repetition (TR). If the TR is sufficiently low,
increased speed of the cerebral blood flow response due to
consumption of vasoactive drugs (such as caffeine) or
natural differences in vascular responsiveness may further
obscure observation of the initial dip.
The BOLD signal is composed of CBF contributions from larger
arteries and veins, smaller arterioles and venules, and
capillaries. Experimental results indicate that the BOLD signal
can be weighted to the smaller vessels, and hence closer to the
active neurons, by using larger magnetic fields. For example,
whereas about 70% of the BOLD signal arises from larger vessels
in a 1.5 tesla scanner, about 70% arises from smaller vessels in
a 7 tesla scanner. Furthermore, the size of the BOLD signal
increases roughly as the square of the magnetic field
strength. Hence there has been a push for larger field
scanners to both improve localization and increase the signal. A
few 7 tesla commercial scanners have become operational, and
experimental 8 and 9 tesla scanners are under development.
Technique
BOLD effects are measured using rapid volumetric acquisition of
images with contrast weighed by T1 or T2*. Such images can be
acquired with moderately good spatial and temporal resolution;
images are usually taken every 1–4 seconds, and the voxels in
the resulting image typically represent cubes of tissue about
2–4 millimeters on each side in humans. Recent technical
advancements, such as the use of high magnetic fields and
multichannel RF reception, have advanced spatial
resolution to the millimeter scale. Although responses to
stimuli presented as close together as one or two seconds can be
distinguished from one another, using a method known as
event-related fMRI, the full time course of a BOLD response to a
briefly presented stimulus lasts about 15 seconds for the robust
positive response.
fMRI studies draw from many disciplines
fMRI is a highly interdisciplinary research area and many
studies draw on knowledge in several fields:
Physics: Physical principles underlie fMRI signals and many
studies require an understanding of these underlying principles.
Psychology: Almost all fMRI studies are essentially cognitive
psychological, cognitive psychophysiological, and/or
psychophysical experiments in which the MRI scanner is used to
obtain an extra set of measurements in addition to behavioral or
electroencephalographic measurements.
Neuroanatomy: The fMRI signals can be put into the context of
previous knowledge only with an understanding of the
neuroanatomy.
Statistics: Correct application of statistics is essential to
"tease out" observations and avoid false-positive results.
Electrophysiology: Familiarity with neuronal behavior at the
electrophysiological level can help investigators design a
useful fMRI study.
Advantages and Disadvantages of fMRI
Like any technique, fMRI has advantages and disadvantages, and
in order to be useful, the experiments that employ it must be
carefully designed and conducted to maximize its strengths and
minimize its weaknesses.
Advantages of fMRI
It can noninvasively record brain signals without risks of
ionizing radiation inherent in other scanning methods, such as
CT or PET scans.
It has high spatial resolution. 2–3 mm is typical but resolution
can be as good as 1mm.
It can record signal from all regions of the brain, unlike
EEG/MEG which are biased towards the cortical surface.
fMRI is widely used and standard data-analysis approaches have
been developed which allow researchers to compare results across
labs.
fMRI produces compelling images of brain "activation".
Disadvantages of fMRI
-
The images produced must be interpreted carefully, since
correlation does not imply causality, and brain processes are
complex and often non-localized.
-
Statistical methods must be used
carefully because they can produce false positives. One team
of researchers studying reactions to pictures of human
emotional expressions reported a few activated voxels in the
brain of a dead salmon when no correction for multiple
comparisons was applied, illustrating the need for rigorous
statistical analyses.
-
The BOLD signal is only an indirect
measure of neural activity, and is therefore susceptible to
influence by non-neural changes in the body. This also means
that it is difficult to interpret positive and negative BOLD
responses.
-
BOLD signals are most strongly associated
with the input to a given area rather than with the output.
It is therefore possible (although unlikely) that a BOLD
signal could be present in a given area even if there is no
single unit activity.
-
fMRI has poor temporal resolution. The BOLD response peaks
approximately 5 seconds after neuronal firing begins in an area.
This means that it is hard to distinguish BOLD responses to
different events which occur within a short time window. Careful
experimental design can reduce this problem. Also, some research
groups are attempting to combine fMRI signals that have
relatively high spatial resolution with signals recorded with
other techniques, electroencephalography (EEG) or
magnetoencephalography (MEG), which have higher temporal
resolution but worse spatial resolution.
-
fMRI has often been used to show activation localized to
specific regions, thus minimizing the distributed nature of
processing in neural networks. Several recent multivariate
statistical techniques work around this issue by characterizing
interactions between "active" regions found via traditional
univariate techniques.
-
The BOLD response can be affected by a variety of factors,
including: drugs/substances; age, brain pathology; local
differences in neurovascular coupling; attention; amount
of carbon dioxide in the blood; etc.
For these reasons, Functional imaging provides insights into
neural processing that are complementary to insights of other
studies in neurophysiology.
Scanning in practice
Subjects participating in a fMRI experiment are asked to lie
still and are usually restrained with soft pads to prevent
movement from disturbing measurements. Some labs also employ
bite bars to reduce motion, although these are unpopular as they
can be uncomfortable. Small head movements can be corrected for
in post-processing of the data, but large transient motion
cannot be corrected. Motion in excess of around 3 millimeters
results in unusable data. Motion is an issue for all
populations, but most especially problematic for subjects with
certain medical conditions (e.g. Alzheimer's Disease or
schizophrenia) or with young children. Participants can be
habituated to the scanning environment and trained to remain
still in an MRI simulator.
An fMRI experiment usually lasts between 15 minutes and an hour.
Depending on the purpose of study, subjects may view movies,
hear sounds, smell odors, perform cognitive tasks such as
n-back, memorization or imagination, press a few buttons, or
perform other tasks. Researchers are required to give detailed
instructions and descriptions of the experiment plan to each
subject, who must sign a consent form before the experiment.
Safety is an important issue in all experiments involving MRI.
Potential subjects must ensure that they are able to enter the
MRI environment. The MRI scanner is built around an extremely
strong magnet (1.5 teslas or more), so potential subjects must
be thoroughly examined for any ferromagnetic objects (e.g.
watches, glasses, hair pins, pacemakers, bone plates and screws,
etc.) before entering the scanning environment.
Related techniques
Aside from BOLD fMRI, there are other related ways to probe
brain activity using magnetic resonance properties:
Diffusion based functional MRI
Neuronal activity produces some immediate physical changes in
cell shape that can be detected because they affect the
compartment shape and size for water diffusion. A much improved
spatial and temporal resolution for fMRI data collection has now
been achieved by using diffusion MRI methodology that can detect
these changes in neurons. The abrupt onset of increased
neuron cell size occurs before the metabolic response commences,
is shorter in duration and does not extend significantly beyond
the area of the actual cell population involved. This
technique is a diffusion weighted technique (DWI). There is some
evidence that similar changes in axonal volume in white matter
may accompany activity and this has been observed using a DTI
(diffusion tensor imaging) technique. The future importance
of diffusion-based functional techniques relative to BOLD
techniques is not yet clear.
Contrast MR
An injected contrast agent such as an iron oxide that has been
coated by a sugar or starch (to hide from the body's defense
system), causes a local disturbance in the magnetic field that
is measurable by the MRI scanner. The signals associated with
these kinds of contrast agents are proportional to the cerebral
blood volume. While this semi-invasive method presents a
considerable disadvantage in terms of studying brain function in
normal subjects, it enables far greater detection sensitivity
than BOLD signal, which may increase the viability of fMRI in
clinical populations. Other methods of investigating blood
volume that do not require an injection are a subject of current
research, although no alternative technique in theory can match
the high sensitivity provided by injection of contrast agent.
Arterial spin labeling
Arterial Spin Labeling (ASL), also known as arterial spin
tagging, is an MRI technique capable of measuring cerebral blood
flow (CBF) in vivo. ASL is capable of providing cerebral
perfusion maps, without requiring the administration of a
contrast agent or the use of ionizing radiation, as it uses
magnetically-labeled endogenous blood water as a
freely-diffusible tracer. It was first proposed in 1992 and has since benefited from a number of modifications aimed at
improving its robustness. ASL can monitor changes in CBF with
activation and fMRI studies can therefore be conducted using ASL
instead of relying on the BOLD effect. ASL fMRI is less popular
than BOLD, as it suffers from a lower signal to noise ratio, can
be less sensitive to weak stimuli and its temporal resolution is
poorer than in BOLD studies. On the plus side, it can
provide quantitative measures of a single well-defined
parameter, CBF, whose baseline value can also be determined in
the same experiment. It has also been found to outperform BOLD
in terms of stability to slow signal drifts and localization of
the activation area. The ASL activation signal is believed
to be dominated by changes in the capillary bed of the activated
area of the cortex, where as the BOLD signal is likely to be
dominated by changes in the oxygenation of nearby veins.
Magnetic resonance spectroscopic imaging
Magnetic resonance spectroscopic imaging (MRS) is another,
NMR-based process for assessing function within the living
brain. MRS takes advantage of the fact that protons (hydrogen
atoms) residing in differing chemical environments depending
upon the molecule they inhabit (H2O vs. protein, for example)
possess slightly different resonant properties (chemical shift).
For a given volume of brain (typically > 1 cubic cm), the
distribution of these H resonances can be displayed as a
spectrum.
The area under the peak for each resonance provides a
quantitative measure of the relative abundance of that compound.
The largest peak is composed of H2O. However, there are also
discernible peaks for choline, creatine, N-acetylaspartate (NAA)
and lactate. Fortuitously, NAA is mostly inactive within the
neuron, serving as a precursor to glutamate and as storage for
acetyl groups (to be used in fatty acid synthesis) — but its
relative levels are a reasonable approximation of neuronal
integrity and functional status. Brain diseases (schizophrenia,
stroke, certain tumors, multiple sclerosis) can be characterized
by the regional alteration in NAA levels when compared to
healthy subjects. Creatine is used as a relative control value
since its levels remain fairly constant, while choline and
lactate levels have been used to evaluate brain tumors.
Diffusion tensor imaging
Diffusion tensor imaging (DTI) is a related use of MR to measure
anatomical connectivity between areas. Although it is not
strictly a functional imaging technique because it does not
measure dynamic changes in brain function, the measures of
inter-area connectivity it provides are complementary to images
of cortical function provided by BOLD fMRI. White matter bundles
carry functional information between brain regions. The
diffusion of water molecules is hindered across the axes of
these bundles, such that measurements of water diffusion can
reveal information about the location of large white matter
pathways. Illnesses that disrupt the normal organization or
integrity of cerebral white matter (such as multiple sclerosis)
have a quantitative impact on DTI measures.
fMRI and EEG
Functional MRI has high spatial resolution but relatively poor
temporal resolution (of the order of several seconds).
Electroencephalography (EEG) directly measures the brain's
electrical activity, giving high temporal resolution
(~milliseconds) but low spatial resolution. The two techniques
are therefore complementary and may be used simultaneously to
record brain activity.
Recording an EEG signal inside an MRI system is technically
challenging. The MRI system introduces artifacts into the EEG
recording by inducing currents in the EEG leads via Faraday
induction. This can happen through several different mechanisms.
An imaging sequence applies a series of short radiofrequency
pulses which induce a signal in the EEG system. The pulses are
short and relatively infrequent, so interference may be avoided
by blanking (switching off) the EEG system during their
transmission. Magnetic field gradients used during imaging also
induce a signal, which is harder to remove as it is in a similar
frequency range to the EEG signal. Current is also induced when
EEG leads move inside the magnet bore (i.e. when the patient
moves during the exam). Finally, pulsed blood flow in the
patient in the static magnetic field also induces a signal
(called a ballistocardiographic artifact), which is also within
the frequency range of interest. The EEG system also affects the
MRI scan. Metal in the EEG leads and electrodes can introduce
susceptibility artifacts into MR images. Care must also be taken
to limit currents induced in the EEG leads via the MRI RF
system, which could heat the leads sufficiently to burn the
subject.
Having simultaneously recorded EEG and fMRI data, the final
hurdle is to co-register the two datasets, as each is
reconstructed using a different algorithm, subject to different
distortions.
Nuclear neuroimaging
Before the advent of fMRI functional neuroimaging was typically
performed with positron emission tomography (PET) scanners or
more rarely with SPECT scanners. Niels A. Lassen and his
coworkers lead the earliest efforts of functional neuroimaging,
using radioactive gases to construct images of the working
brain.
These nuclear imaging techniques do not use the nuclear magnetic
resonance property and employ entirely different scanners.
Approaches to fMRI data analysis
The ultimate goal of fMRI data analysis is to detect
correlations between brain activation and the task the subject
performs during the scan. The BOLD signature of activation is
relatively weak, however, so other sources of noise in the
acquired data must be carefully controlled. This means that a
series of processing steps must be performed on the acquired
images before the actual statistical search for task-related
activation can begin.
For a typical fMRI scan, the 3D volume of the subject's head is
imaged every one or two seconds, producing a few hundred to a
few thousand complete images per scanning session. The nature of
MRI is such that these images are acquired in Fourier transform
space, so they must be transformed back to image space to be
useful. Because of practical limitations of the scanner the
Fourier samples are not acquired on a grid, and scanner
imperfections like thermal drift and spike noise introduce
additional distortions. Small motions on the part of the subject
and the subject's pulse and respiration will also affect the
images.
The most common situation is that the researcher uses a pulse
sequence supplied by the scanner vendor, such as an echo-planar
imaging (EPI) sequence that allows for relatively rapid
acquisition of many images. Software in the scanner platform
itself then performs the reconstruction of images from Fourier
transform space. During this stage some information is lost
(specifically the complex phase of the reconstructed signal).
Some types of artifacts, for example spike noise, become more
difficult to remove after reconstruction, but if the scanner is
working well these artifacts are thought to be relatively
unimportant. For pulse sequences not provided by the vendor, for
example spiral EPI, reconstruction may have to be done by
software running on a separate platform.
After reconstruction the output of the scanning session consists
of a series of 3D images of the brain. The most common
corrections performed on these images are motion correction and
correction for physiological effects. Outlier correction and
spatial and/or temporal filtering may also be performed. If the
task performed by the subject is thought to produce bursts of
activation which are short compared to the BOLD response time
(on the order of 6 seconds), temporal filtering may be performed
at this stage to attempt to deconvolve out the BOLD response and
recover the temporal pattern of activation.
At this point the data provides a time series of samples for
each voxel in the scanned volume. A variety of methods are used
to correlate these voxel time series with the task in order to
produce maps of task-dependent activation.
There are many software packages available for analyzing fMRI
data.
Reconstruction of MRI data needs to be tested, calibrated and
confirmed. MRI can suffer from numerous artifacts that include,
geometric distortions, Nyquist ghosting, and signal dropout.
Medical Imaging Phantoms are used to provide a consistent
geometrical source for calibration and testing purposes. Minute
tumor changes can require recalibration by use of a phantom to
quantify the change.
Commercial use
Most fMRI scans are for research or clinical use. Commercial use
is limited. However, a few companies have been set up that
attempt to sell fMRI specific hardware or services for research
or clinical use.
At least two companies have been set up to use fMRI in lie
detection (No Lie MRI, Inc and Cephos Corporation.
In using fMRI techniques for use in lie detection, activated
areas of the brain are observed while the subject is making a
statement. Depending on what regions are the most active, the
technician might determine whether a subject is telling the
truth or not. Since a specific combination of brain functions
are needed in order to tell a lie, the simultaneous activation
of these regions often indicates deception. This technology is
in its early stages of development, and many of its proponents
hope to replace older lie detection techniques.
In clinical trials, the usage of fMRI as a method of lie
detection has appeared reliable, with studies from 2005 by Kozel
et al. indicating a 90% to 93% success rate.
However, there is still a fair amount of controversy over
whether these techniques are reliable enough to be used in a
legal setting. Some studies indicate that while there is an
overall positive correlation, there is a great deal of variation
between findings and in some cases considerable difficulty in
replicating the findings.
 |
Neuro fMRI/DTI
Combi Package #T+D |
 |
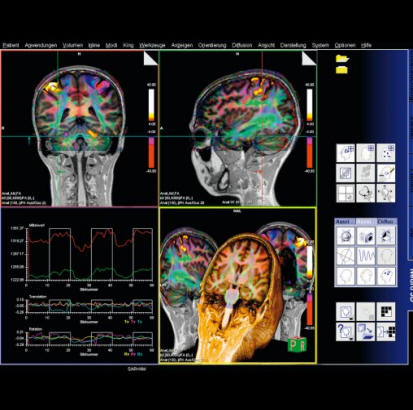
The Neuro
fMRI/DTI Combi Package is a bundle of:
- Inline BOLD Imaging :Performing a Motor Cortex Functional Exam
- 3D PACE syngo : Prospective Acquisition CorrEction
- BOLD 3D Evaluation syngo
- fMRI Trigger Converter
- Diffusion Tensor Imaging
- DTI Evaluation
- DTI Tractography syngo
The bundle comprehends all acquisition and postprocessing tools
for comprehensive BOLD fMRI and DTI exams. BOLD fMRI experiments
can be displayed fused with DTI data and anatomy. The package is
particularly valuable for presurgical planning. The 3D display
of anatomical images, functional brain mapping results and DTI
allows a better understanding of the spatial relationship
between eloquent cortices, cortical landmarks, brain lesions and
tract shifts of white matter.
Inline BOLD Imaging
The BOLD imaging package allows the user to define protocols
which, apart from the measurement, configure automatic
evaluation of the measured data during the scan. With Inline
Technology it is thus possible to generate statistical images
(t-value) based on 3D motion corrected and spatially filtered
data automatically in real time without any further user
interaction. The Inline display of activation cards allows the
user to decide during the scan whether enough statistical power
has built up for his brain mapping task or if the examination is
corrupted by motion. As a result examinations will be shorter
with a higher success rate. Functional brain mapping can be
easily integrated into the clinical routine e.g. prior to
neurosurgical interventions.
Additional Features:
- Inline retrospective 3D motion detection and correction in 3
rotational and 3 translational directions
- Inline t-statistics calculation for variable paradigms and
display of t-value images
- Statistical evaluation by means of “General Linear Model
(GLM)”:
- Paradigms can be configured
- Transitions between passive and active states can be modeled
by the hemodynamic response function
- Correction of low-frequency trends
- Allows for time delays due to the BOLD-EPI slice order during
a measurement
- Display of GLM design matrix
- Display of a continuously updated t-value card during
measurement
- Display of colored activation cards continuously updated
during measurement, overlaid over the respective BOLD images
using Inline technology
- MOSAIC image mode for accelerating display, processing and
storage of images
3D PACE syngo
By tracking the patients head 3D PACE reduces motion resulting
in increased data quality beyond what can be achieved with a
retrospective motion correction. As a result the sensitivity and
specificity of BOLD experiments are increased.
Features:
- Real time prospective motion correction: Highest accuracy real
time motion detection algorithm feeding a real time feed back
loop to the acquisition system with updated positioning
information
- 3D motion correction for 6 degrees of freedom (3 translation
and 3 rotation)
- Motion related artifacts are avoided in first place instead of
correcting for them retrospectively
- Significant reduction of motion-related artifacts in
statistical evaluations
- Increased sensitivity and specificity of BOLD experiments
BOLD 3D Evaluation syngo
All tasks from statistical evaluation of the fMRI datasets to
reading and exporting results are supported by BOLD 3D
Evaluation syngo:
Generation of statistical maps:
- In cases an inline calculated statistical map is not available
a statistical map can be generated easily using processing
protocols. An intuitive editor UI allows the paradigm definition
and offers the selection of head motion correction, image
filters and statistical evaluation.
- Predefined processing protocols and paradigms are available,
which can be edited if required.
Statistical evaluation using General Linear Model (GLM)
- Transitions between passive and active states modeled by the
hemodynamic response function.
- Correction of low-frequency trends.
- Corrects for time delays due to the BOLD-EPI slice order
during a measurement.
- Output of a t-value map and the GLM design matrix
Inline monitoring of the fMRI exam
- During an ongoing BOLD imaging exam results are calculated (by
Inline BOLD imaging) and displayed in real time.
- The results are displayed and continuously updated as an
overlay on online adjustable, free angulated cut planes through
the anatomical 3D data set.
- The evolving signal time courses in task-related areas of
activation can be displayed and monitored.
Visualization of fMRI Results
- Visualization with 3D volume rendering.
- Superimposing on cut planes through the volume.
- Interactive Navigation: Zoom, pan and rotate in 3D without
noticeable delay. Free double oblique angulation of up to 6 cut
planes.
- Cine display of the BOLD time series and of EPI volumes in 3
orthogonal cuts for evaluation of non-corrected head motion.
Data Quality Monitoring
- Based on the B0 field map, loaded automatically with the fMRI
data, areas with less reliable results are indicated.
Overview:
syngo BOLD 3D Evaluation
syngo BOLD 3D Evaluation is a comprehensive processing and
visualization package for BOLD fMRI.
Features
•This package provides statistical map calculations from BOLD
datasets and enables the visualization of task-related areas of
activation with 2D or 3D anatomical data. This allows the
visualization of the spatial relation of eloquent cortices with
cortical landmarks or brain lesions
•On the syngo Acquisition Workplace the unique Inline function
of syngo BOLD 3D Evaluation merges, in real time, the results of
ongoing BOLD imaging measurements with 3D anatomical data
•Additionally, evolving signal time courses in task-related
areas of activation can be displayed and monitored
•Functional and anatomical image data can be exported for
surgical planning as DICOM datasets, additionally all color
fused images and results can be stored or printed
•Statistical map generation: paradigm definition, calculation of
t-value map with General Linear Model or t-test
•3D Visualization: fused display of fMRI results,
color t-value maps on anatomical datasets
•Inline 3D real time monitoring of the fMRI acquisition
•On-the-Fly adjustment for t-value thresholding, 3D clustering,
and opacity control
•Data export to neurosurgical planning software
Clinical Applications
•Neurosurgical planning
•Assess the effects of neurodegenerative diseases, trauma or
stroke on brain function
•Brain mapping
|
 |
 |
|
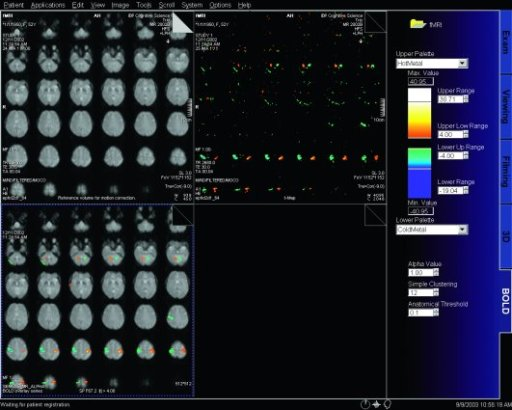
BOLD evaluation task
cards |
Step by step instructions:
1. Load the ep2d_bold_moco series into the BOLD Evaluation Task
card. From the patient browser, select this series and go to
Applications and choose BOLD Evaluation.
2. Choose the moco filter 3D evaluation program. Automatically
the evaluation controller dialog box will appear, when post
processing BOLD data it is freely selectable to choose filters
or motion
3. Adjust the simple clustering to remove noise from BOLD data.
Increasing this value will remove any colored clustered pixels
lower than this number. For example when setting this value to
10 any value of activated (colored) adjacent pixels less than 10
will be hidden from view.
4. Load the t1_se_tra sequence into segment 1. From the patient
browser select this sequence and drag and drop into the upper
left segment. This will fuse the BOLD data with anatomic data
5. Scroll thru the images using the "dog ear tab" of segment
one. This will also move the fused anatomic and functional
slices.
6. Set the transparency of the functional data. Reducing the
Alpha Value will make the functional data more transparent.
7. Save the fused results. Go to patient, and select Save All
Alpha As... This will save all slice positions and allow naming
of the sequence, for easy access in the patient browser.
This series can now be viewed in the viewing card or sent via
PACs for reading.
fMRI Trigger Converter
An optical trigger signal is available to trigger external
stimulation devices in fMRI experiments.
With the "fMRI Trigger Converter" this signal can be converted
to an electrical signal (TTL/BNC and RS 232 interface for PC;
modes: toggle or impulse).
Diffusion Tensor Imaging
Diffusion Tensor Imaging allows for a complete description of
the diffusion properties of the brain within the scope of the
tensor diffusion model, both for anisotropic and isotropic
diffusion. Efficient diffusion direction schemes are pre-defined
to allow for optimal diffusion directional resolution. Schemes
with up to 256 directions can be selected.
Inline technology enables automatic and immediate calculation of
the diffusion tensor, including grey-scale and colored
“fractional anisotropy" (FA) map derived from it.
Details:
- Measurements with up to 256 different directions and with up
to 16 different b-values
- Inline calculation of tensor, grey-scale and colored FA map,
ADC map and trace-weighted image
- Support of parallel imaging (iPAT)
- Clinical protocols with full head coverage, incl. inline
calculation of tensor, FA, ADC and trace-weighted images in 4
minutes.
DTI Tractography syngo
syngo DTI Tractography is optimized for the clinical use by
providing advanced 3D visualization of white matter tracts in
the context of 2D or 3D anatomical datasets and DTI datasets.
DTI data sets can be explored fast and intuitively using the
interactive QuickTracking. QuickTracking instantaneously
displays the tract originating from the mouse pointer position
while moving over the DTI data set. This also allows identifying
qualified regions to place seeding ROIs. Seed points can be set
to assess connectivity by tracking with single ROI and with
multiple ROIs. Furthermore they can be placed in fused views
displaying the anatomical reference and e.g. the colored FA map
simultaneously.
Texture Diffusion, a highly versatile in-plane visualization of
white matter tracts, allows to display and read DTI Tractography
results on PACS reading stations and in the OR.
At the same time the package provides the scientific user with
the flexibility to configure the tracking algorithm and to
change display settings for the tracts. Tract and seeding ROI
statistics are included to support publications (e.g. mean/max
FA value, min/mean/max ADC value).
All views can be exported as DICOM images or bitmaps. Tract and
seeding ROI statistics can be exported as html files.
DTI Evaluation
Clinical applications are supported by a dedicated DTI
evaluation mode to support diagnostics of white matter diseases
(e.g. multiple sclerosis and brain maturation disorders). Based
on the tensor, in addition to the already inline-calculated
parameter maps, further maps characterizing the anisotropy of
diffusion properties can be calculated and stored. Multiple
diffusion parameter maps (e.g. Fractional Anisotropy, ADC, b=0)
and an anatomical image are displayed next to each other in the
same slice position for comparison. The images can be evaluated
together based on ROIs and the results can be documented in a
table. The display options include 2D and 3D tensor graphics,
color-coded images and overlay images on the anatomical images.
In addition, the package offers the scientific user full
flexibility of 2- and 3-dimensional visualization of the
diffusion tensor with measures of isotropic and anisotropic
(fractional and relative) diffusion, Eigen vectors (E1, E2, E3)
of the diffusion tensor and shape-descriptive measures of the
diffusion tensor (linear, planar, spherical).
 |
fMRI methods for
reduced k-space coverage |
 |
Keyhole
acquire full k-space as reference
acquire reduced low-frequency k-space fMRI study
fill in missing k-space from reference
Half-Fourier
acquire 50-60% of k-space starting at
highest ky
theoretical symmetry used to fill in missing ky
Sensitivity encoding (SENSE)
Multiple RF coils with independent signal for
each (parallel imaging)
Calibration maps from full k-space
each coil part of k-space
2X improvement EPI, 4X for GE
UNFOLD
Acquire k-space in sequential time segments
time 1 acquire lines 1, 5, 9, 13 ...
time 2 acquire lines 2, 6, 10, 14 ...
time 3 acquire lines 3, 7, 11, 15 ...
time 4 acquire lines 4, 8, 12, 16 ...
reorder into k-space
4x faster per segment reduces inter echo
distortions
|
|
|